How to Calculate the Maximum Elevation Figure (MEF) on a Sectional Chart

Taking an FAA exam and stumbled across a question involving the Maximum Elevation Figure (MEF)? Wondering how to find the Maximum Elevation Figure for a quadrant of a chart? It turns out that there are two different formulas for calculating the Maximum Elevation Figure based on different terrain.
The Maximum Elevation Figure shows up on a sectional chart as a large number with a slightly smaller number next to it as illustrated in the image above with the red circle. These numbers have two digits dropped off of the end, so [large] 2 [small] 6 is 2,600 feet.
Every half of a degree of latitude and longitude have a Maximum Elevation Figure illustrated on the map, every degree of latitude and longitude has 4 Maximum Elevation Figures calculated based on Terrain and Manmade objects. MEF is calculated using the Mean Sea Level (MSL) elevation on a chart.
Have questions about calculating the MEF or other Part 107 material? Join our Drone Community Facebook Group and ask!

Obstructions Legend on a Sectional Chart.
Maximum Elevation Figure | Terrain Obstructions
Naturally occurring obstructions, such as mountains, we'll find the highest elevation and add 100 feet to allow for error in the overall measurement, add 200 feet for obstruction allowance and finally round up to the next 100 feet.
Let's calculate the Natural Obstruction MEF of this chart

We find the highest terrain elevation in the area to be 2298.
Add 100 feet to allow for vertical error
2298 + 100 = 2398
Add 200 feet for vertical obstruction allowance
2398 + 200 = 2598
Round up to the next 100 feet
2600
Maximum Elevation Figure | Manmade Obstructions
Calculating the MEF of a building or structure is different from naturally occurring obstructions. In man made obstructions, we add 100 feet for vertical error and round up to the nearest 100 feet - and that's all. No tolerance for obstruction allowance.
Let's calculate the Manmade MEF of this chart
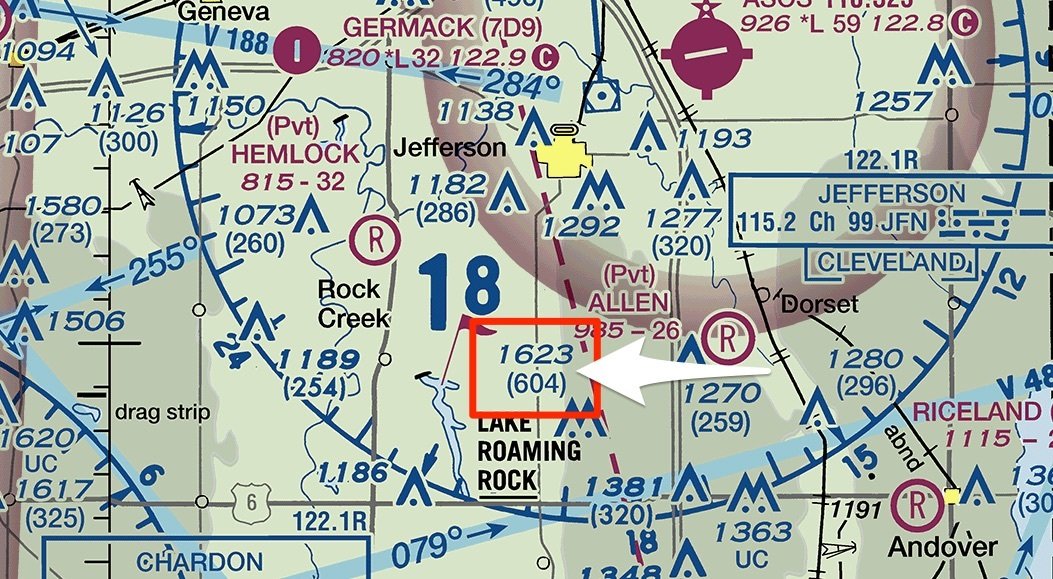
We find the highest manmade elevation in the area to be 1623.
Add 100 feet to allow for vertical error
1723.
Round up to the next 100 foot mark
1800.
Conclusion
While a sectional chart might look overwhelming at first, the more you study the chart and read the information - the more the chart will begin to make sense. Understanding these carts will allow you to know which parts of your area you can and cannot fly, need approval to fly in, elevations you can legally fly and so much more. Even if you aren't applying for a FAA sUAS Part 107, you can appreciate the seemingly insane amount of information that is packed into these sectional charts and use the data to be a better pilot.
What's the hardest part of a sectional chart for you to read?